

INTRODUCTION
Toxoplasma gondii is an obligate intracellular protozoan parasite with global distribution among humans and animals. Under normal conditions, T. gondii infection is largely asymptomatic, but in individuals who are immunocompromised, such as patients with AIDS, the parasite can become widely disseminated, causing severe toxoplasmosis and/or encephalitis (Tenter et al., 2000). Many studies have shown that normally avirulent strains of T. gondii are highly virulent in T-lymphocyte-deficient animals (Suzuki et al., 1988; Gazzinelli et al., 1992). Therefore, T-cell-mediated immune responses are central to protection against intracellular T. gondii infection (Denkers and Gazzineli, 1998; Denkers 1999).
The mucosal epithelial layer provides the interface between the external and the internal environments of the gastrointestinal tract. Gut intraepithelial lymphocytes (IEL) and epithelial cells are continually exposed to pathogens and important arbitrators of host immunity (McDonald, 1999). IEL from the small intestine are unique in cellular composition and development compared with other peripheral T cells. The peritoneal cavities of mice have been often used as a model for local infection with various microorganisms, and the composition of peritoneal exudate cells (PEC) varies greatly depending on the cause of the exudate. Furthermore, intraperitoneal immunization of animals has been used as an extremely effective route of immunization for the induction of both systemic and mucosal immune responses (Orga et al., 1994; Krausz and Barker, 1995). Therefore, PEC and IEL are targeted primarily to prevent local or systemic disease, and serve as an immunologic barrier against a wide range of infectious agents (Orga et al., 1994; McGhee and Kiyono, 1999). However, PEC and IEL differ in their cellular composition and development, and it is important to study the functional properties of T cells from these cells in order to understand local immunity.
Cytokines are important mediators of immune responses, and are produced by a variety of activated cells. Interferon-gamma (IFN-γ) plays a major role in resistance to T. gondii infection in mice (Denkers and Gazzineli, 1998; Denkers 1999). Neutralization of IFN-γ leads to the death of mice infected with an avirulent T. gondii strain, and induces disease reactivation due to cyst rupture in chronically infected mice (Suzuki et al., 1988). IEL have a number of important immunological functions, including cytotoxic activity, secretion of cytokines, and modulation of epithelial cell death and regeneration (Orga et al., 1994; McDonald, 1999; McGhee and Kiyono, 1999). The peritoneal cavity presents various immune-related cells such as lymphocytes, macrophages, granulocytes and plasma cells, and has also been used to induce systemic and mucosal immune responses (Orga et al., 1994; Krausz and Barker, 1995). However, there is little information about IFN-γ production of the T cells in PEC and IEL, especially in PEC.
To evaluate the functional properties of local T cell subsets in PEC and IEL during acute murine toxoplasmosis, we isolated these cells from C57BL/6 mice after oral infection with T. gondii and analyzed the phenotypic profiles of each T cell subset. We also compared IFN-γ production in T cell subsets using dual-color immunofluorescence at the single-cell level and analyzed changes in the composition of the cells.
MATERIALS AND METHODS
Mice and T. gondii infection
Specific pathogen-free, female, inbred C57BL/6 mice at 8 to 10 weeks old were obtained from the Korea Research Institute of Bioscience and Biotechnology (Daejeon, Korea) and were maintained in the proved facilities. Mice were infected orally with 40 brain cysts from the 76K strain of T. gondii, and control mice received an equal volume of uninfected brain. They were sacrificed at day 0 (before infection), and days 1, 4, 7, and 10 postinfection (PI), and PEC and IEL were harvested. Each group consisted of five mice.
Isolation of PEC and IEL
At the indicated times, mice were anesthetized and exsanguinated. PEC were collected by peritoneal lavage with 6 to 8 ml of Hanks' balanced salt solution (HBSS), and the lavage was repeated three times per mouse. Red blood cells contaminated were removed with sterile distilled water. Then, the cells were suspended in RPMI 1640 medium (GibcoBRL, Gaithersburg, MD) containing 10% heat-inactivated fetal bovine serum (FBS; Sigma Chemical Co., St. Louis, MO), 1 mM sodium pyruvate, 2 mM L-glutamine, 5 nM 2-mercaptoethanol, 100 units/ml penicillin and 100 µg/ml streptomycin (Sigma).
IEL were isolated as described by Chardes et al. (1994). The small intestines were flushed with phosphate-buffered saline (PBS), and Payer's patches were removed and cut into 2 cm sections. Each section was opened longitudinally. The small intestine mucosa was scraped and dissociated by mechanical disruption with a magnetic stirrer for 15 min in RPMI 1640 medium containing 5% FBS and 1 mM dithioerythritol (Sigma). Tissue debris and cell aggregates were removed by passage over a glass wool column (1.3 g packed in a 20-ml syringe) in HBSS with 5% FBS. IEL were obtained by centrifugation on a Ficoll layer (d-1.077; Sigma Chemical Co.). Cells were then suspended in the same medium used for the PEC. After isolation, a hemocytometer was used to count the number of PEC and IEL in each mouse.
Differential cell counts of PEC and IEL by microscopy
To obtain differential PEC and IEL cell counts, each cell suspension was cytocentrifuged onto glass slides with 7×10⁴ cells in a total of 500 µl at 700 rpm for 5 min (Cytospin 3; Shandon Lipshaw, Pittsburgh, PA), and air dried. The cells were fixed in methanol and stained with Diff-Quik (Baxter Scientific Products, McGraw Park, IL). The cell suspensions were divided into lymphocytes, macrophages and neutrophils/eosinophils by light microscopy, and the relative percentage of each component was determined. Preparations were examined at magnifications of 200 to 400×.
Phenotypic T cell analysis by flow cytometry
T cell phenotypic analysis was performed by single color, direct fluorescence using a flow cytometer. PEC and IEL (1×10⁶ cells) from control and infected mice were incubated with 50 µl of Fc Block (diluted 1:100 with 0.1% BSA/PBS; PharMingen, San Diego, CA). The cells were incubated for 20 min at 4℃ and further incubated with 50 µl (diluted 1:100 with 0.1% BSA/PBS) of FITC-labeled anti-mouse CD4, CD8α, NK-1.1 or γδ monoclonal antibody (mAb) (PharMingen) for 60 min at 4℃. Control group cells were stained with κ isotype control FITC-labeled rat IgG2a mAb (PharMingen) under the same conditions. Cells were washed three times with 0.1% BSA/PBS by centrifugation, fixed with 1% paraformaldehyde, and analyzed by flow cytometry (FACScan; Becton Dickinson, Mountain View, CA).
Analysis of intracellular IFN-γ production by flow cytometry
Intracellular IFN-γ was detected by flow cytometry as described by Lee et al. (1999). PEC or IEL from uninfected (used for negative and positive controls) and infected mice at each time point were prepared in complete PRMI 1640 medium containing 10% heat-inactivated FBS for 4 hr at 37℃ in 5% CO2 and treated with Brefeldin A (10 µg/ml; Sigma). To prepare the positive control, cells from uninfected mice were cultured with Brefeldin A, PMA (10 ng/ml; Sigma) and ionomycin (500 ng/ml; Sigma) under the same conditions. Then, the cells were washed with 0.1% BSA/PBS at 1,500 rpm for 5 min at 4℃, incubated for 20 min at 4℃ with Fc Block, and further incubated with FITC-labeled anti-mouse CD4, CD8α, NK-1.1, or γδ mAb, or with κ isotype control FITC-labeled rat IgG2a mAb for 1 hr at 4℃. Subsequently, the cells were washed three times with 0.1% BSA/PBS and fixed in 50 µl of solution A (Cell Perm and Fix, Caltag, South San Francisco, CA) for 30 min at 4℃ with shaking. Then, the cells were washed three times with 0.1% BSA/PBS and incubated in 50 µl of permeabilization solution B (Caltag), which was mixed with 50 µl of PE-labeled anti-IFN-γ (diluted 1:50 with 0.1% BSA/PBS, PharMingen) or κ isotype control PE-labeled rat IgG1 mAb (PharMingen), for 1 hr at 4℃. Following the incubation, the cells were washed and fixed with 1% paraformaldehyde.
Cell events were acquired and dead cells were gated out of the analysis based on forward and side light scatter. Ten thousand cells were counted per sample and the data were analyzed with Cell-Quest software (Becton Dickinson). Negative control samples were prepared in parallel with all experimental samples, and the threshold for the detection of IFN-γ-producing cells was arbitrarily set at less than 1.0% of the negative control. At this cutoff level, there were only slight variations between the percentages of IFN-γ-producing cells in each case. Positive control samples were obtained by stimulating PEC or IEL in vitro for 4 hr with 10 ng/ml PMA and 500 ng/ml ionomycin.
Statistical analysis
Statistical evaluations of differences in cell numbers, differential cell counts, percentage of T cell phenotypes and intracellular IFN-γ production were determined using the nonparametric Mann-Whitney U test and Student's t test. Differences between the various groups were considered significant when p values were < 0.05.
RESULTS
The increased ratio of total IEL number was higher than the that of PEC.
PEC and IEL were isolated at several time points after mice were orally infected with T. gondii, and the total cell number per mouse was counted with a hemocytometer (Table 1).
Uninfected mice had 1.15 ± 0.32×10⁶ PEC, whereas the number of PEC per mouse increased significantly in the infected mice at days 4 and 7 PI compared to uninfected control mice, and decreased thereafter: The total number of PEC per infected mouse ranged from 1.09 ± 0.51×10⁶ (day 1 PI) to 1.98 ± 0.47×10⁶ (day 4 PI).
Trypan blue staining revealed that the viability of isolated IEL was 95 2%. The total number of IEL per uninfected mouse was 1.12 ± 0.56×10⁶. In the infected mice, the number of IEL increased significantly from day 4 PI compared to uninfected control mice, the total number of IEL per mouse ranging from 1.28 ± 0.61×10⁶ (day 1 PI) to 3.06 ± 0.82×10⁶ (day 7 PI) after T. gondii infection.
The relative percentages of macrophages and neutrophils/eosinophils increased significantly in PEC, but not in IEL.
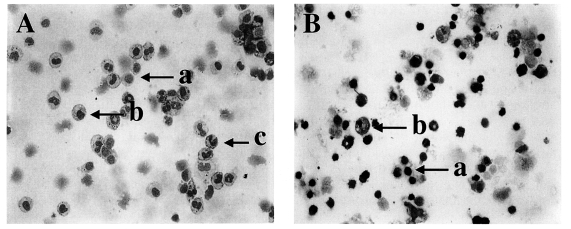
To analyze changes in the composition of PEC and IEL, the cells were stained with Diff-Quik solution (Fig. 1A and 1B). Table 2 shows the relative percentages of PEC and IEL lymphocytes, macrophages and neutrophils/eosinophils from C57BL/6 mice.
The relative percentages of lymphocytes, macrophages and neutrophils/eosinophils in PEC in the uninfected mice were 73.7 ± 5.6%, 21.7 ± 4.3% and 4.6 ± 0.5%, respectively. After T. gondii infection, the relative percentage of lymphocytes decreased at days 1 PI (58.9 ± 5.7%, p=0.032) and 4 PI (58.5 ± 6.3%, p=0.0038) as compared to uninfected mice, and increased gradually thereafter. Macrophages and neutrophils/eosinophils showed the opposite pattern; the relative percentage of macrophages reached a maximum at day 4 PI (35.6 ± 3.1%), and neutrophils/eosinophils were significantly increased at day 1 PI (6.9 ± 1.3%, p=0.0316), 4 PI (5.9 ± 1.0%. p=0.0316) and 10 PI (6.0 ± 1.2%, p=0.0426).
Lymphocytes were the major IEL cellular component throughout the experiments (94.1 ± 7.4% - 95.0 ± 2.1%). In the infected mice, the relative percentage of macrophages in IEL was slightly increased at days 1 (5.6 ± 1.5%, p=0.0832) and 10 PI (4.5 ± 1.5%, p=0.4194) than in uninfected mice (3.95 ± 1.2%). Control and infected mice had a similar percentage of neutrophils/eosinophils.
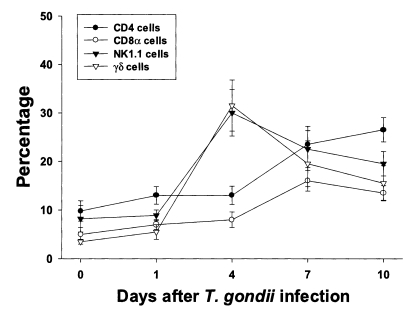
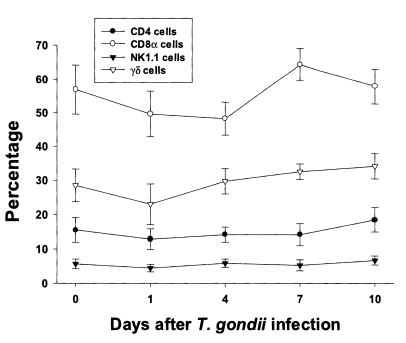
CD4 and NK1.1 cells were the major T cell subsets in PEC, whereas CD8α and γδ cells were the major T cell subsets in IEL
The proportion of each T cell subset in PEC is shown in Fig. 2. The percentages of CD4, CD8α, NK1.1 and γδ T cells were 9.8 ± 2.1%, 5.0 ± 1.4%, 8.2 ± 2.7% and 3.5 ± 0.5%, respectively. The percentages of CD4 and CD8α T cells increased slowly until day 4 PI, and increased substantially thereafter. At day 10 PI, CD4 T cells were the major PEC cellular component (26.5 ± 2.5%). The percentages of γδ and NK1.1 T cells sharply increased after day 1 PI, peaked at day 4 PI (30.0 ± 4.8% in NK1.1 T cells, p < 0.0001; 31.5 ± 5.3% in γδ T cells, p < 0.0001), and decreased thereafter.
In uninfected mice, the relative percentages of CD4, CD8α, NK 1.1 and γδT cells in IEL were 15.6 ± 3.6%, 56.9 ± 7.3%, 5.7 ± 1.4%, and 28.5 ± 4.8%, respectively (Fig. 3). CD8α cells was the most common T cell phenotype in the IEL of infected and uninfected mice. The proportion of CD8α and γδT cells was not significant changes until day 1 or 4 PI, and thereafter they gradually increased but not significant differences compared to uninfected mice (48.2 ± 4.9% - 64.3 ± 4.8% in CD8α T cells, 0.0578 < p < 0.9734; 23.0 ± 5.9% - 34.1 ± 2.2% in γδ T cells, 0.0727 < p < 0.6697). There was no significant change in the percentage of CD4 and NK1.1 T cells after T. gondii infection compared to uninfected mice (0.1702 < p < 0.2755).
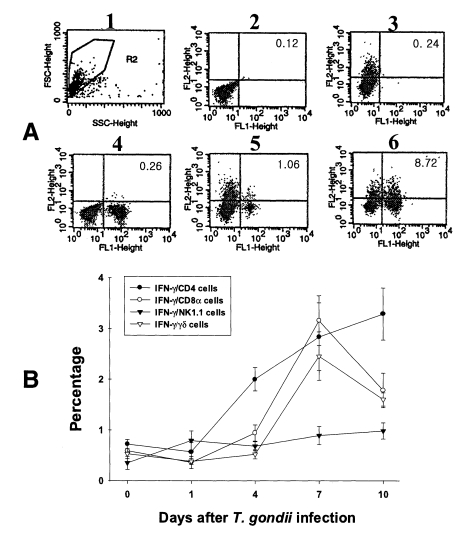
The major IFN-γ-producing T cell subsets were CD4 cells in PEC and CD8α cells in IEL.
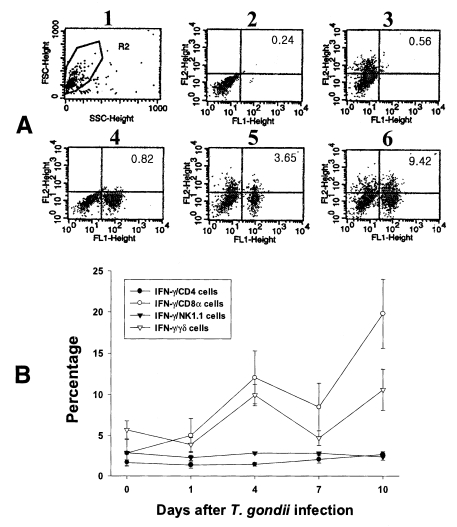
PEC and IEL were double labeled to stain both cell-surface antigens and intracytoplasmic IFN-γ. Negative controls of PEC and IEL were made at each time point to set the cutoff level using the uninfected mice (Fig. 4A and 5A). Figures 4B and 5B show the proportion of IFN-γ-producing T cell subsets from PEC and IEL in mice infected with T. gondii.
In uninfected mice, the proportion of IFN-γ-producing CD4, CD8α, NK1.1 and γδ T cells in PEC were 0.72 ± 0.09%, 0.59 ± 0.02%, 0.35 ± 0.13% and 0.53 ± 0.10%, respectively. In the infected mice, the percentage of IFN-γ-producing CD4 T cells significantly increased after day 1 PI, and was 3.29 ± 0.51% at day 10 PI (p < 0.0001). The percentage of IFN-γ-producing CD8α and γδ T cells abruptly increased after day 4 PI, and peaked at day 7 PI (3.16 ± 0.49% and 2.46 ± 0.48%, respectively). The proportion of IFN-γ-producing NK1.1 T cells significantly increased at day 1 PI (0.79 ± 0.19%, p=0.0027) compared to uninfected mice, and was then maintained at similar levels throughout the experimental period (p < 0.0027).
In the uninfected mice, the proportions of IFN-γ-producing CD4, CD8α, NK1.1 and γδ T cells in IEL were 1.70 ± 0.34%, 2.86 ± 0.16%, 2.90 ± 0.18% and 5.69 ± 1.10%, respectively. Following T. gondii infection, CD8α T cells were the major IFN-γ-producing T cell subset in IEL and their proportion increased from the beginning of infection and peaked at day 10 PI (19.80 ± 4.20%, p < 0.0001). The γδ T cells were also prominent IFN-γ producers after infection (3.9 ± 0.85% - 10.6 ± 2.59%, 0.003 < p < 0.158), and their production pattern was similar to that of CD8α T cells. The proportion of IFN-γ-producing CD4 T cells were slightly increased after infection (1.4 ± 0.4% - 2.7 ± 0.34%, 0.0016 < p < 0.320), however, IFN-γ-producing NK1.1 T cells did not change significantly (2.3 ± 0.3% - 2.86 ± 0.15%, 0.0616 < p < 0.8772).
DISCUSSION
After an oral infection with T. gondii cysts, the parasite follows the alimentary canal, crosses the intestine to reach the mesenteric lymph nodes and then the spleen by the lymphatic vessels, and then are disseminated all over the host by the blood stream (Sumyuen et al., 1995; Zenner et al., 1998). Many studies have been conducted on the induction of a splenic (systemic) T cell response to T. gondii (Lee et al., 1999 and 2000), however the importance of local immunity against acute infection with this parasite is less well understood. IEL represent a primary immune barrier against infection by orally acquired pathogens. In this study, CD8α T cells were found to be the major T cell subset in IEL from both uninfected and infected mice, followed by γδ T cells. However, the proportion of CD4 and NK1.1 T cells was less than 20%. This unique T cell phenotype in the IEL suggests that many IEL developed independently of thymic influence (Poussier and Julius, 1994; McDonald, 1999). In the murine lamina propria, cryptopatches (clusters of lymphohaematopoietic cells) might be an important source of thymus-independent T cells (Saito et al., 1998).
In susceptible C57BL/6 mice, SAG1 gene of T. gondii was demonstrated widely in the small intestine and mesenteric lymph nodes at 24 hr PI (Kobayashi et al., 1999). Thus, cells in the peritoneal cavity may be activated in the early stage after oral infection with T. gondii cysts through mesenteric lymph nodes or lymphatic channels (Sumyuen et al., 1995; Zenner et al., 1998; Kobayashi et al., 1999). In the present study, lymphocytes were found to be the major PEC cellular components in both uninfected and infected mice. After T. gondii infection, the relative percentages of macrophages and neutrophils/eosinophils in PEC first increased, and then decreased. This pattern is similar to those observed in case of E. saphenum infection (Salam et al., 2001). However, the relative percentages of lymphocytes in PEC first decreased and then normalized, whereas the percentages of T cell subsets were increased. These data may be caused that the percentage of B lymphocytes was decreased after infection in contrast to increase of T cell subsets (the data of B lymphocytes were not shown). Especially, the percentages of NK1.1 and γδ T cells sharply increased after infection, earlier than those of CD4 or CD8α T cells. These results indicate that NK1.1 and γδ T cells may play an important role in the early host response to infection with T. gondii (Kasper et al. 1996; Vicari and Zlotnik, 1996) by increasing quickly and abundantly.
IFN-γ is a critical effector for the protective immune response to T. gondii (Suzuki et al. 1988), and this cytokine was increased at 100 day PI (Deckert-Schluter et al., 1995). However we have little information about the kinetics of IFN-γ levels and the functional properties of local T-lymphocytes for IFN-γ synthesis. In this study, CD4 T cells were the predominant IFN-γ producers in the PEC, both before and after infection with T. gondii. The pattern of ex vivo IFN-γ production by CD4 T cells was similar to the kinetics of IFN-γ-producing CD4 cells in the splenic (systemic) T cells (Lee et al., 1999). CD8 T cells are of major importance in the generation of protective immunity against toxoplasmosis (Denkers and Gazzineli, 1998; Denkers 1999). γδ T cells exhibit a CTL response against parasite-infected macrophages and produce significant quantities of IFN-γ (Ferrick et al., 1995; Kasper et al., 1996). In the present study, the proportion of IFN-γ-producing CD8α and γδ T cells increased significantly in both PEC and IEL after T. gondii infection, but the kinetics for each were different: IFN-γ-producing CD8α and γδ IEL increased earlier and were more abundant in IEL than in PEC. These data suggest that CD8 and γδ IEL form the first line of defense against orally ingested pathogens, and that they participate in modulating host immunity by releasing various cytokines, including IL-2, IL-3, IL-5, TNF-α, TGF-β and, most apparently, IFN-γ (Buzoni-Gatel et al., 1997; McDonald, 1999). Moreover, IFN-γ-producing CD8α and γδ IEL also increased earlier and were more abundant than splenic CD8α and γδ T cells (Lee et al., 1999). These data also suggest that IEL T cells are modulated and produce various cytokines earlier than systemic T cell responses following oral pathogen infection.
NK1.1 T cells have various roles as NK cells, CD4 Th2 cells, and CD8 T cells (Vicari and Zlotnik, 1996). The proportion of IFN-γ-producing NK1.1 T cells in PEC increased significantly from day 1 PI, and these phenomena were also seen in splenic T cell response (Lee et al., 1999). These results suggest that NK1.1 T cells are also an important first-line defense in PEC and splenocyte cell responses (Vicari and Zlotnik, 1996; Lee at al., 1999).
These observations reveal that, following oral infection with T. gondii, PEC and IEL, have different cell compositions, T cell phenotypes, and intracellular IFN-γ production patterns. PEC T cell responses were much closer to the splenic (systemic) T cell responses in this case, but Th1 responses were stronger in IEL T cells than in PEC T cells. In the future, we plan to compare the PEC and IEL T cell responses after intraperitoneal infection with T. gondii bradyzoites.