

INTRODUCTION
Mitochondrial (mt) genomes are an evolutionary paradox. There are many reasons why genomes should not have persisted in mitochondria - and yet they have indeed persisted (Saccone et al. 2002). Mitochondrial genomes also exhibit features not seen, or not as pronounced, in nuclear genomes. Among these are biases in base composition that must have an influence on the protein subunits for which they code. Studies on mitochondrial codon usage investigating this phenomenon have mainly focused on vertebrates.
We have an ongoing program of sequencing and characterising mitochondrial genomes from parasitic flatworms (Le et al., 2000a, 2000b). The major classes of parasitic flatworms, Trematoda, Monogenea and Cestoda, belong to a larger monophyletic taxon, the Neodermata. This taxon is distinct from other members of the Platyhelminthes (Littlewood and Bray 2001). Arising largely from our previous work, it is now clear that mt genomes of neodermatans resemble those of other metazoans in their organisation (Le et al., 2000a, 2000b). We have previously noted striking differences in base composition among these genomes (Le et al., 2002b). Here, we report codon usage and associated phenomena for as many of these genomes as are currently available.
MATERIALS AND METHODS
Available to us for analysis were DNA sequences encompassing all protein-coding genes of the mitochondria of 11 species of neodermatans, 5 trematodes and 6 cestodes. For an additional trematode species, Schistosoma malayensis, we had sequence for most of the protein-coding genes. Further information on the taxa, GenBank accession numbers and reference sources, are in the footnote to Table 1.
Sequences were aligned using AssemblyLIGN v 1.9c and analysed by MacVector 6.5.3 package (Oxford Molecular Group). Pairwise comparisons of nucleotide and amino acid (aa) sequences of individual genes were undertaken using ClustalW as incorporated into the MacVector 6.5.3 package. Base composition and codon usage was calculated with MacVector 6.5.3, the DNA Strider program (Douglas 1995) and MEGA v2.1 (Kumar et al., 2001 - Arizona State University, Tempe, Arizona, USA).
Translations were done using the neodermatan mt genetic code most recently discussed in Blair et al. (1999), Nakao et al. (2000) and Telford et al. (2000). This code differs from the universal code in that TGA specifies tryptophan, AGA and AGG specify serine, ATA specifies isoleucine and AAA specifies asparagine. Initiation and termination codons will be discussed further below.
The program Tree-Puzzle v5 (Strimmer and von Haeseler, 1996) was used to explore base composition variation and amino-acid composition variation among the mt genomes examined. This program uses a chi-square test to determine whether the base composition of each sequence is identical to the average base composition of the whole alignment.
Mitochondrial genes of neodermatans are all encoded on the same strand. All calculations of base composition, skew etc used the strand reported in GenBank which is equivalent in sequence to the mRNAs of the various genes.
Skew is the unequal representation on a single strand of complementary bases such as G and C, something frequently reported from mt genomes (e.g. Saccone et al., 2002). Skew was estimated using the AT and GC-skew indices (Perna and Kocher, 1995) where:
AT skew = (A-T)/(A+T) and
GC skew = (G-C)/(G+C)
Values for the skew indices can range from -1 to +1. A value of zero indicates that A = T or G = C in frequency on the strand being analysed. A negative value for AT skew implies that T occurs more frequently than A, and so on.
RESULTS
Termination and initiation codons
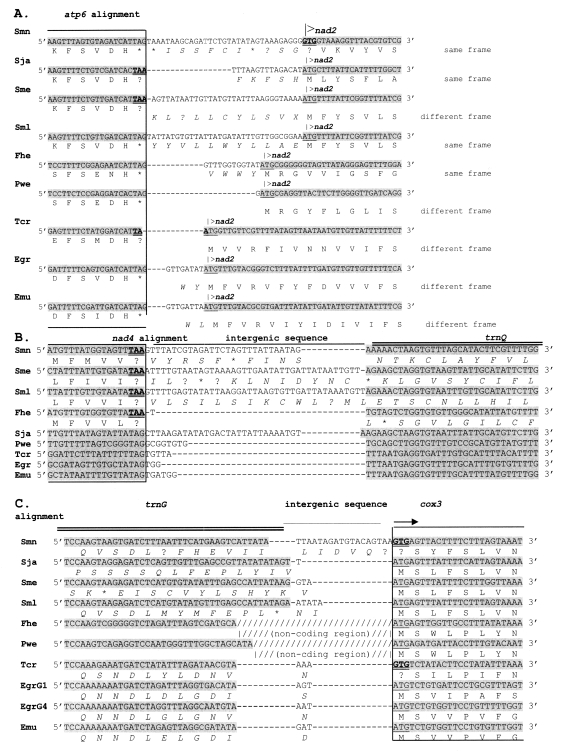
The alignments of 3 gene-junctional blocks are presented in Fig. 1. These alignments comprise junctions between i) two protein-encoding genes (atp6 and nad2; Fig. 1A); ii) a protein-encoding gene and a tRNA gene (nad4 and trnQ; Fig. 1B); and iii) a tRNA and a protein-encoding gene (trnG and cox3; Fig. 1C). As seen in Fig. 1, the amino acid composition of the N-terminus of Atp6 (Fig. 1A) and Nad4 (Fig. 1B) as well as the C-terminus of Cox3 (Fig. 1C) are highly conserved. The C-terminus of Nad2 is less conserved across the range of species surveyed. The conservation of amino acid tracts strongly suggests that atp6 and nad4 can terminate at TAA and cox3 and nad2 may initiate at GTG. The stop codon for atp6 in Taenia crassiceps is discussed below.
Variation in gene length
The general features of the 12 protein-encoding genes are presented in Table 1. Lengths of the individual genes are very similar among closely related species (Table 1). The most striking exceptions are cox1 (encodes 510-609 aa) and cox2 (191-219 aa). Most of the length difference in the former is due to an insertion of about 60 codons near the 5' end in Schistosoma mansoni and in the latter to an insertion of about 20 codons near the 3' end in Schistosoma mekongi. Genes are particularly uniform in length among the cestodes (Table 1), perhaps partly due to the smaller phylogenetic range of cestodes sampled. Among the cestodes, most genes differ in length by 0-4 codons. However, cob in Hymenolepis diminuta is about 10 codons longer than in other cestodes and cox1 in H. diminuta and the G4 genotype (horse-dog strain) of Echinococcus granulosus is 10 or more codons shorter than in other cestodes. The lengths of most genes in cestodes are similar to those of the corresponding genes in trematodes. However, cob in cestodes is shorter than that found in the Asian schistosomes (355-365 aa in cestodes, compared with 371-372 in Asian schistosomes and 364-372 in other trematodes). The cox1 gene encoding 521-539 residues in cestodes is intermediate in length between that in the Asian schistosomes (547-549 aa) and other trematodes (510-511 aa for Fasciola hepatica and Paragonimus westermani, respectively). As mentioned above, S. mansoni has the longest cox1, encoding 609 residues.
Base composition and bias
Base compositions differ among the genomes examined (Table 2). When the DNA sequences of the concatenated protein-coding genes for all taxa were analysed using Tree-Puzzle, each differed significantly from the overall consensus. When S. malayensis (incomplete sequence available), P. westermani, F. hepatica and Taenia crassiceps (all with distinctive base compositions - Table 2) were omitted singly or together, the remaining sequences still differed significantly from the consensus.
Redundancy at the third codon position, especially at four-fold degenerate sites, means that sequences differing significantly in nucleotide frequencies may differ less when translated into amino acid sequences. This may also be expected because the greatest bias in base frequencies is usually observed at third codon positions (Saccone et al., 1999, 2002). However, Tree-Puzzle also rejected the hypothesis that inferred amino-acid composition is uniform across all species. Indeed, all species failed the test when all were included in a single test. Omission of single species, or groups of species, did not yield any cases where remaining species passed the test.
Numbers of each amino acid encoded by each mt genome are shown in Table 3. A 2x20 contingency table showed that many pairs of species differed significantly (5% level) from each other in amino-acid composition. Exceptions were comparisons among the three Schistosoma species and comparisons among the three species/genotypes of Echinococcus. The two Taenia species did not differ significantly from each other or from H. diminuta, a surprising finding given that they differed significantly from taeniids in the genus Echinococcus. Interestingly, S. mansoni (a trematode) did not differ significantly from Taenia solium (a cestode). This is not the only apparent example of convergence among our neodermatans. F. hepatica and P. westermani, two trematodes that are not closely related to one another (Cribb et al., 2001), did not differ significantly. It is clear that divergences and convergences are frequent at various taxonomic levels, including between the Trematoda and Cestoda.
Despite the fact that codon usage generally differs significantly among species, the common pattern of bias, with high frequencies of T, means that the same amino acids tend to be most commonly observed in all taxa (Table 3). Leucine is the most common amino acid in every case, followed by serine, valine and phenylalanine (not necessarily in that order). The least common amino acids are glutamine, histidine, lysine and arginine (Table 3), regardless of the base composition of the genome.
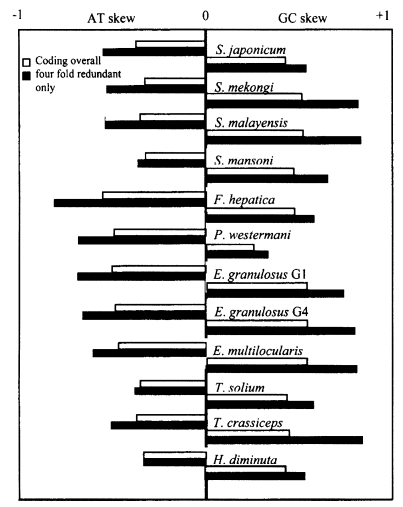
Skew in base composition clearly exists among the neodermatan mt genomes (Table 2, Fig. 2). For example, among the neodermatans, T is the most common base, often reaching a frequency of around 50% (with the notable exception of P. westermani). By contrast, A is usually present at around half this frequency. Table 2 shows the overall base composition of protein-coding genes of the available neodermatans, and also the percentage of each base occurring in the third codon position overall and the third codon position of fourfold redundant codons (FFR). In most neodermatans, the percentage of codons ending with C is no greater than about half the representation of C in the proteincoding genes overall. Particularly low values are noted for S. mekongi (0.9%) and S. malayensis (1% - but note that not all genes were available for analysis in this species) (Table 2). Only in P. westermani is C more represented in third codon positions (21.7%) than in protein-coding genes overall (17.9%). This species also has an unusually high representation of G in third codon positions. Usage of T in third codon positions is usually greater than its overall representation in protein-coding genes (Table 2). The only exception is P. westermani which has by far the lowest overall percentage of T. Similarly, A is under-represented in third codon positions in F. hepatica and P. westermani (Table 2).
Among neodermatans, skew values vary considerably. AT-skew is least in S. mansoni and greatest in F. hepatica (Fig. 2). GC-skew is least in P. westermani, reflecting the relatively high occurrence of C. The greatest GC-skews are seen in S. malayensis, S. mekongi and the Echinococcus species.
DISCUSSION
A first requirement in characterising genes is to determine where they start and end. ATG and TAG are regarded as the typical mt stop and start codons respectively in neodermatans. However, we have presented evidence (Blair et al., 1999; Le et al., 2000a) that TAA can also act as a stop codon and GTG as an alternative start codon in neodermatans (as reported for other metazoans: Wolstenholme, 1992). In this study, we have confirmed that these two codons (GTG and TAA) can act respectively to initiate and terminate a gene.
Using a similar approach, we have inferred that the initiation codon of cox1 in the cestode H. diminuta is GTT (Le et al., 2002b) (Table 1) thus agreeing with von Nickisch-Rosenegk et al. (2001). In the latter paper, the initiation codon for nad4 is stated to be ATT. However, an in-frame ATG is situated 6 codons further upstream and we regard this as the correct start codon.
Pairs of genes may overlap, leading to interpretive difficulties. For example, in T. crassiceps, the last A of the stop codon (TAA) of atp6 is shared with the ATG start codon in the following nad2 gene (Fig. 1A). The former could be interpreted as a truncated stop codon or as an actual overlap between two genes. Abbreviated stop codons (T or TA) are known from some metazoans (Wolstenholme, 1992). There is only one example of this among the neodermatans. In T. solium, nad1 ends with a T (Nakao, unpublished). Von Nickish-Rosenegk et al. (2001) suggested that cox1 in H. diminuta is terminated with such a codon (T). However, our later analysis including sequences from several other cestodes indicate that a normal stop codon (TAG) is present here in cestodes but this requires overlap with the downstream trnT (Le et al., 2002a).
Tree-Puzzle always rejected the null hypothesis of equal base or amino-acid composition. A partial explanation for this might be that Tree-Puzzle requires a minimum of four species before it will run the analysis, but we did not have four sufficiently close relatives to include. When only four taeniid cestodes, E. granulosus G1 (sheep-dog strain) and G4 (horse-dog strain) genotypes, E. multilocularis and T. solium were included, all failed the test, although marginally in the case of the E. granulosus G4 genotype and E. multilocularis.
Associated with codon bias is the phenomenon of skew (unequal representation on a single strand of complementary bases). A well-developed theory is available to explain this situation, at least in the case of mammals (Saccone et al., 2002). The asymmetric nature of mt replication means that one of the strands remains in a single-stranded state for relatively long periods. During this time it is prone to particular mutational changes, specifically a reduction in C and A on that strand and a corresponding increase in G and T. Skew is likely to be most pronounced at third codon positions, and especially at four-fold degenerate sites, where any mutational change is synonymous and not subject to selection pressure. Although little is known about the mode of mt replication in phyla other than vertebrates, an echinoderm and a few insects, base composition bias and strong skew are observed in many phyla (Saccone et al., 1999) including flatworms, suggesting that similar mechanisms may operate. As predicted by the theory outlined above, base composition bias and skew are most evident in third codon positions among neodermatans. The pattern observed among neodermatans is similar to that seen in vertebrates, with four-fold redundant sites showing the most extreme skew (Fig. 2). The main difference is that, among vertebrates, GC-skew has a negative value and AT-skew a positive value (Perna and Kocher, 1995). Nematodes and at least some molluscs exhibit negative AT-skew values and positive GC-skew values, as in neodermatans (Perna and Kocher, 1995). The sign of the skew value reflects only the strand being investigated: each strand will have the same value for each skew statistic, but with the opposite sign (Perna and Kocher, 1995).
Reyes et al. (1999) found that, among mammals, bias and skew were greatest in the regions of the mt genomes where the heavy strand was exposed as single-stranded for the longest time during replication. If the mode of replication in neodermatans is similar to that in mammals, we might expect the same pattern. Given that the locations of the origin(s) of replication are unknown in neodermatan mt genomes, and that they probably differ among taxa (as evidenced by the differing location of long non-coding regions (Le et al., 2002a), we did not feel able to explore this in detail. However, marked differences in skew and bias were noted among genes in a single neodermatan genome (data not shown) as reported by Reyes et al. (1999) for mammals. Analysis of sequences from additional neodermatan taxa may make it possible to infer the nature of the replication process.
Deviations in base composition (and amino-acid composition) among species will violate a basic assumption implicit in many algorithms used to infer phylogenies and can lead to construction of incorrect topologies (Foster and Hickey, 1999). Despite the considerable differences among neodermatan species in nucleotide sequences, and corresponding differences in amino-acid sequences, phylogenetic trees (not shown) inferred from either class of data recover the topology expected from the known systematic relationships among these taxa. This should not be taken as evidence that base composition differences will not affect tree topologies when sequences from a wider array of neodermatan taxa are added. All but two of the species included here fall into two relatively narrow but well-separated systematic groups (trematodes of the family Schistosomatidae and cestodes of the order Cyclophyllidea). Base composition differences would presumably have to be extreme to fail to recover these two groups. The two remaining trematodes, P. westermani and F. hepatica, which have similar base compositions, form a group elsewhere in the tree.
Previous studies have revealed that mt genomes of neodermatans are similar in most respects to those of other bilateral metazoans (Le et al., 2000a). However, these genomes vary considerably in the location(s) of long non-coding regions presumed to have a role in replication, and in the length and structure of these regions (Le et al., 2000a). There is also variation in gene order which, in African schistosomes, is very different from that of all other taxa sequenced to date (Le et al., 2001). Here, we have shown that there can be convergence as well as divergence in nucleotide, and hence amino acid, composition among taxa. A pattern is thus emerging of diversity in the mt genome in neodermatans that may cast light on evolution of mt genomes generally. Certainly, there is a need of data from additional neodermatan taxa, and from flatworms generally. Once these patterns are better understood, mt genome data can be put to practical use in evolutionary and population/species-level studies of important parasites such as the schistosomes (Le et al., 2000b).