

INTRODUCTION
Retrotransposons are discrete segments of DNA that comprise a major portion of eukaryotic genomes (SanMiguel et al., 1996; Li et al., 2001). They are able to replicate themselves within genomes via the reverse transcription of an mRNA intermediate (Boeke et al., 1985). Retrotransposons are largely grouped into long-terminal-repeat (LTR) and non-LTR [or poly(A)] retrotransposons, according to their overall structures (Boeke and Stoye, 1997). LTR retrotransposons exhibit high level of similarities to retroviruses in their structures, coding capacities and integration mechanisms. Recent phylogenetic analyses based on the amino acid sequences of Pol proteins encoded in retrotransposons demonstrate that each of these two groups is composed of several distinct clades, whose members are thought to be more closely related to each another (Malik et al., 1999; Malik and Eickbush, 1999, 2001). Putative evolutionary relationships among these retrotransposon clades including retroviruses are also well established (Xiong and Eickbush, 1990; Malik and Eickbush, 2001).
The expansion of retrotransposons might result in damaging effects on the host genome such as insertional mutagenesis and chromosomal translocations, which may be associated with the inactivation of adjacent gene(s) and the disruption of chromosomal integrity. In contrast, other evidence has suggested that retrotransposons and their hosts have coevolved. The integration of these elements into new sites within genomes could provide genomic variations ranging from simple sequence polymorphism to large-scale alterations in chromosomal structure (Finnegan, 1989). Therefore, retrotransposons are recognized as major agents in evolution that give rise to phenotypic variants and, in long term, to drive speciation (Lönnig and Saedler, 1997). These elements have recently been used as informative markers to compensate for the weakness of current phylogenetic studies, which are largely based on the sequence data of ribosomal and mitochondrial DNAs (Nikaido et al., 1999).
The evolutionary roles of retrotransposons are relatively well established in plants. However, the polymorphic distributions of retrotransposons and their effects on phenotypes have not been widely studied in animal models except for Drosophila species and Caenorhabditis elegans. In addition, the common model organisms used for studying the biological implications of retrotransposons such as D. melanogaster and C. elegans are experimental inbred lines. It is well known that mobile activities (Pouteau et al., 1991) and copy numbers (Charlesworth and Charlesworth, 1995) of retrotransposons in inbred lines differ from those of natural populations. Thus, these popular model systems are not ideal for representing the elements in natural conditions despite their advantages, such as their small and relatively simple genome structures. Since the life stages of the trematode cannot be maintained in the laboratory from eggs to adults, genomic events observed in adults represent those that have occurred under natural conditions. Together with the fact that the copy numbers of retrotransposons in lower animals are generally small, these characteristics might provide apparent advantages in the trematode in terms of examining the integration polymorphisms of retrotransposons and relating them to phenotypic variations in order to estimate the role(s) of retrotransposons in evolutionary terms.
We have previously reported upon the isolation and characterization of a novel Gypsy-like LTR retrotransposon, CsRn1, from the genome of Clonorchis sinensis, a causative agent of hepatobiliary diseases in mammals including humans (Bae et al., 2001). The element has a high copy number of over 100 per haploid genome and has preserved its mobile activity. In this study, we investigated the evolutionary course of CsRn1 by conducting a phylogenetic analysis using LTR and reverse transcriptase (rt) gene sequences of multiple CsRn1 copies. CsRn1 copies could be subdivided into several subsets which showed difference in their integration times according to their degree of sequence divergence. Evidences supporting a presumed evolutionary course among these subsets are also presented.
MATERIALS AND METHODS
Parasite and DNA extraction
Clonorchis sinensis metacercariae were collected from a fresh-water fish, Pseudorasbora parva in an endemic area, Gyeongsangnam-Do, Korea. The metacercariae were orally inoculated into NewZealand white rabbits. Rabbits were killed 3 - 5 months after infection and the adult worms were harvested from the bile duct. Worms were washed with physiological saline for five times at 4℃, and DNA was immediately extracted using a Wizard DNA Purification Kit (Promega, Madison, WI, USA) according to the manufacturer's instructions.
Retrieval of sequences from the LTR and rt sequences of CsRn1 copies, and their flanking regions
The genomic DNA library of C. sinensis was screened using an LTR probe of CsRn1, as previously described (Bae et al., 2001). The insert regions of positive lambda clones were amplified using a long PCR method using primers designed from vector regions (5'-CTAATACGACTCACTATAGGGCGTC G-3' and 5'-CCCTCACTAAAGGGAGTCGACTCG-3') and LA Taq polymerase in the standard cycle conditions (Takara, Shiga, Japan). The amplified products were used directly in the sequencing reactions as templates. The primers used in the reactions were as follows: 5I-Rev for 5'-LTR and its upstream region, 5'-CGACTAAATCCGCTGAATC-3'; 3I-Fow for 3'-LTR and its downstream region, 5'-GAAACTTGAAGTGAGCAAC-3'; RT-F for the rt region, 5'-GACGAAAGGTCCACCTGTC-3'. These primers were designed from the consensus sequence of CsRn1 (Bae et al., 2001).
Sequence analysis
Nucleotide sequences were automatically determined using a ABI PRISM 377 DNA sequencer (Applied Biosystems, Foster City, CA, USA) and BigDye Terminator Cycle Sequencing Reaction Kit (Perkin Elmer Corporation, Foster City, CA, USA). To ensure the accuracy of the sequencing reactions, sequences from a single strand of each template were determined three times. After sequencing, homology searches with the sequences of each flanking region were made against the non-redundant database at the National Center for Biotechnology Information (NCBI; http://ncbi.nlm.nih.gov/) using BLASTX algorithms. The nucleotide sequences of LTRs were aligned by ClustalX. After optimizing the sequence alignment using GeneDoc, divergence values were calculated and a dendrogram was drawn using the DNADIST and NEIGHBOR programs, respectively, in the PHYLIP package. The tree was displayed by TreeView and the statistical significance of each branching point was evaluated with 1000 random samplings of the input sequence alignment using SEQBOOT. Sequence homology values CsRn1 LTRs were calculated from alignment using the PHYDIT program (Chun, 2001).
Inter-retrotransposon amplified polymorphism (IRAP)
Primers were designed to match the 5'-(5'-ACGAT TATGCAATTGATG-3') and 3'-end(5'-TATTTCTTTG CCACACAC-3') of the consensus CsRn1 LTR sequence in the outward direction. IRAP PCR was performed in reaction mixtures containing 40 ng of genomic DNA individually extracted, 0.5 µM of primers, 0.2 mM each of dATP, dGTP, dCTP, and dTTP, 1.6 mM MgCl2, and 1.25 units of Taq polymerase (Takara) in 2 mM Tris-HCl buffer (pH 8.0). PCR cycling parameters were as follows: 4 min at 94℃; 32 cycles of 30 sec at 96℃, 40 sec at 60℃, and 2 min at 72℃; followed by 10 min at 72℃. The PCR products were analyzed by electrophoresis on 2% NuSieve 3:1 agarose (BioWhittaker Molecular Applications, Rockland, ME, USA) and detected by ethidium bromide staining.
PCRs for locus-specific typing of CsRn1
Primers designed from flanking (Table 3) and internal regions of CsRn1 (3I-Fow, see above), and genomic DNAs individually extracted were used in the PCRs. The reaction mixtures contained 20 ng of genomic DNAs, 0.2 µM of primers, 0.2 mM each of dATP, dGTP, dCTP, and dTTP, 2 mM MgCl2, and 1.25 units of Taq polymerase (Takara) in 2 mM Tris-HCl buffer (pH 8.0). PCR cycling parameters were as follows: 4 min at 94℃; 32 cycles of 30 sec at 96℃, 40 sec at 58-62℃, and 1 min at 72℃; followed by 10 min at 72℃. The products were fractionated by electrophoresis on agarose gels and stained with ethidium bromide. To test the specificity of the reactions, the products were hybridized with an LTR probe by Southern blotting.
RESULTS
Phylogenetic analysis of CsRn1 LTR sequences from multiple loci
To obtain information on the sequences and integration patterns of CsRn1 copies in C. sinensis genomes, LTRs and their flanking regions were sequenced from 62 different phages obtained during screening of the genomic DNA library. The uniqueness of each locus were confirmed by comparing their flanking regions, and then the LTR sequences from 57 CsRn1 copies residing in different loci were retrieved. Of these, both LTRs were sequenced in 21 copies, while only 5'- or 3'-LTR sequences were obtained from six and 30 CsRn1 elements, respectively. The LTRs had an average length of 470 bp and showed homology value of 97.2%. Among 21 copies in which both LTRs were sequenced, eight copies (CsRn1-10, -15, -19, -39, -81, -82, -100, and -115) were flanked by identical LTRs.
The clustering patterns of CsRn1 copies and the degrees of sequence divergence among members of each cluster were examined by performing a phylogenetic analysis with an alignment of LTR sequences of CsRn1 from the 57 loci (in cases of the 21 full-unit copies, only 3'-LTR sequences were used in the analysis). Clustering patterns in the phylogenetic tree (Fig. 1) and conservations in their base-substitution positions (data not shown) revealed that most CsRn1 copies could be grouped into four subsets (Roman numerals in Fig. 1). Branching nodes connecting members of each subset were statistically well supported by bootstrap analysis. The average branch lengths within a subset cluster varied substantially, with subset I sequences being divergent and subset IV sequences being more similar to each other. The CsRn1 copies with identical flanking LTRs were clustered into the less divergent subset IV.
Subsets of CsRn1 element
The structure of the CsRn1 LTR phylogram suggests that sequences of different clusters represent integrations separated in time during the genomic evolution of C. sinensis. To gain insight into the evolutionary history of CsRn1 subsets, the divergence values of LTR sequences within a subset were determined. As shown in Table 1, the observed values were found to be quite different in the four subsets, reflecting differences in their integration times. Fractions of each subset were inversely proportional to the divergence values. Since there is no available data for predicting the rate of sequence divergence in platyhelminthes, the age of each subfamily could not be properly estimated.
The probable mobile activity of LTR retrotransposons can be predicted from the degree of the sequence conservation shown by both LTRs (Dangel et al., 1995) and the positions of base substitutions in internal coding regions (Petrov et al., 2000). The rt sequences of CsRn1, ranging from two to five copies for each subset, were obtained to analyze sequence variations in this coding region. The sequenced regions comprised 536 bp of 7 conserved domains in RT (Bae et al., 2001). After aligning, a consensus sequence and similarity values were determined (Table 2). The rt regions had strong homology to the consensus sequence (average value of 99.34%). Except for those of subsets I and II, the other sequences showed extremely low divergence (a maximum of two substitutions in 536 bp). Base substitutions in subset II were shared at six positions among its members, and, of these, one substitution was also found in subset I. The other positions were randomized and no further clonality was found (data not shown). Deletions and insertions were also not found.
Similarities of rt sequences were slightly higher than those of LTRs among members of each subset, and rt sequences of all copies having identical LTRs showed 100% homology to the consensus sequence (Table 2). If base substitutions observed in the rt sequence were introduced into the active lineage, they might exhibit evidence of purifying selection at the amino acid level. Thus all substitutions were classified as affecting either the non-synonymous or synonymous positions of the codons. As shown in Table 2, substitution positions in members of subsets from I to III showed patterns of neutral evolution, in that a similar level of base substitutions was found at the three codon positions. Among substitutions in subset II which showed clonality, three were non-synonymous and the others were synonymous. Considering the repetition of these substitutions, the changes in non-synonymous positions might not result in the inactivation of the copies. Due to the small numbers of base substitutions, the evolution mode could not be defined in the other subset.
Locus-specific typing of CsRn1 among individual worms of C. sinensis
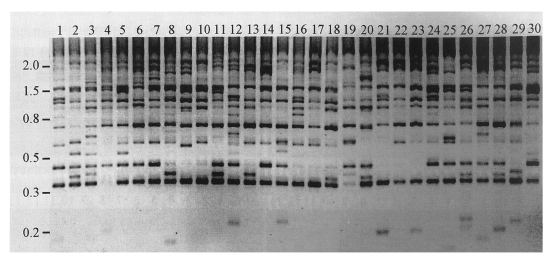
One resulting phenomenon of a recent spread of a retrotransposon is significant allelic dimorphisms (presence or absence) caused by heterogeneous integrations of the element into haploid genomes. The distribution of CsRn1 was found to be polymorphic among individual genomes in the studied C. sinensis population (Fig. 2). To test the putative evolutionary course of CsRn1 subsets predicted by sequence analyses at the genomic level, their relative integration times were determined by examining selected loci in the C. sinensis population.
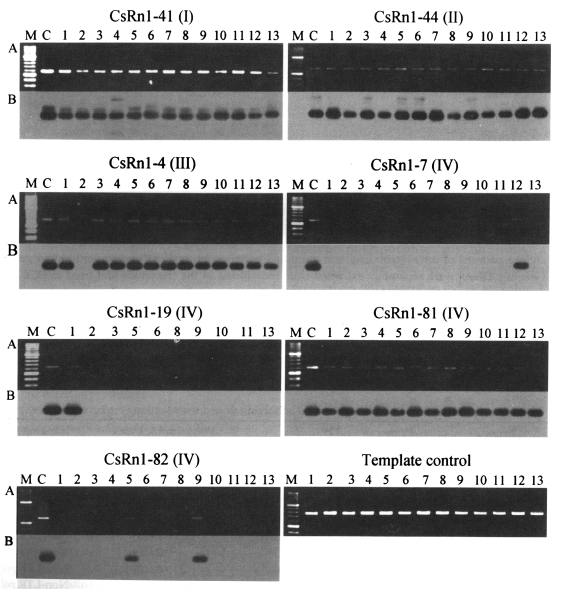
The availability of sequence information in CsRn1-occupying loci facilitated the design of primers to use in PCRs to amplify homologous loci from each individual genome. PCR analyses were performed with primers specific to the internal region of CsRn1 and its various flanking regions. As shown in Fig. 3 and Table 3, the integration patterns of CsRn1 copies among individuals were well matched to the evolutionary course of the elements predicted by sequence and phylogenetic analyses. CsRn1 elements belonging to subsets I and II were presented at the corresponding loci in all worms examined, whereas certain fractions of subsets III (33%) and IV (58%) exhibited polymorphic distributions among individuals. The degrees of polymorphisms (expressed as polymorphic index in Table 3) were found to be very diverse among loci tested. In cases of these polymorphic loci, the results were confirmed with second primers and the same amplification patterns were obtained (data not shown). Together with the differential sequence divergences (Tables 1, 2), locus-specific typing of CsRn1 (Fig. 3) demonstrated that CsRn1 elements have multiplied in the host genome according to a master element model (Clough et al., 1996), with apparent master lineages arising differentially during the evolutionary course of the host genome.
Sequences in the CsRn1-containing loci
Retrotransposons can affect the expression of genes present in regions of their integration and these may introduce phenotypic variations among individuals of a species (Whitelaw and Martin, 2001). Since the integration patterns of CsRn1 were shown to be heterogeneous in a C. sinensis population (Figs. 2, 3), the downstream sequences of CsRn1 in several loci were analyzed for the presence of any functional gene(s). The sequences were determined from inserts of lambda clones by primer working and used as queries to search for homologous sequences in GenBank database at the amino acid level (Table 3). Out of 17 loci analyzed, flanking sequences from six loci (CsRn1-2, -7, -16, -19, -39, and -85) exhibited strong homologies with Pol proteins of non-LTR retrotransposons. There were no overlapping regions among these sequences. Flanking sequences of CsRn1-15 and -82 were matched to Gag protein of a putative LTR retrotransposon and found to overlap over 1077 bp with a homology of 97.6%. LTR and rt sequences of CsRn1-15 and -82 were found to be identical, and these two CsRn1 copies showed polymorphic indices of 15.4% and 84.6%, respectively, by locus-specific typing. These facts suggest that CsRn1-15 and -82 are multiplied from a common master copy of CsRn1, although their integration times are different. Sequence variation in the overlapping regions might be the result to differences in the LTR retrotransposon copies into which they have integrated. Sequences of the other loci did not show significant homology to any known gene.
DISCUSSION
Retrotransposons should be transcribed by their host RNA polymerase and then reverse transcribed by their own reverse transcriptase, to produce progeny. Because these two enzymes have no proofreading capacity (Varmus and Brown, 1989), cDNAs produced during these processes tend to acquire random base substitutions. These base substitutions frequently inactivate the progeny copies, and the resulting "dead-on-arrival (DOA)" copies with no mobile activity are likely to be subjected to neutral evolution, through which the accumulation of sequence variations within the DOA copies is accelerated (Petrov et al., 1996). Thus, together with the acquisition of base substitutions during the transposition process, the neutral evolution of inactive DOA copies may have an additional effect on sequence divergence among multiple copies of a retrotransposon.
If base substitutions introduced in a newly produced progeny do not affect mobility of the copy, the variant can independently produce its own progeny, and this separated multiplication would lead to formation of a different lineage (i.e. subset). Members of a subset share the substituted diagnostic base(s) in conserved position(s). During evolutionary time, a particular subset of retrotransposon expands differentially, rather than simultaneously, from other variant subsets with selective advantage for the expansion (Clough et al., 1996). Due to this preferential multiplication, copies belonging to the master subset replace those of other subsets, which have expanded prior to the master copies (Boissinot et al., 2000). Accordingly, a subset acting as an active master can be distinguished from others by the lowest level of sequence divergence among its members and by the largest population of the subset (Medstrand and Mager, 1998). CsRn1 copies of subset IV satisfied these criteria (Tables 1, 2) and thus, the copies of subset IV are suggested to be master copies responsible for the multiplication of CsRn1. Members of other subsets might have expanded their progenies during different evolutionary times, prior to the multiplication of subset IV.
High sequence identity between flanking LTRs of individual copies can also be accepted as a hallmark of their recent integration, since a pair of LTRs use the same sequences as a template for their replications (Dangel et al., 1995). CsRn1 copies belonging to subset IV have similar or identical LTRs (data not shown), showing their recent expansion. Furthermore, the neutral evolution mode of rt sequences in members of subsets from I to III demonstrated that these copies have lost their mobile activity for a long time (Table 2). The preserved mobile activity of subset IV has been previously suggested at the transcription level by examining the presence of its mRNA transcripts (Bae et al., 2001).
The evolutionary history of multiple subsets of a retrotransposon predicted by sequence analyses could be confirmed at the genomic level by tracing their integration patterns among individual genomes (Medstrand and Mager, 1998). If a copy of a retrotransposon has integrated into a genomic locus during an earlier evolutionary time, the retrotransposon-occupying locus might be fixed in all haploid genomes, whereas recently integrated copies are likely to be heterogeneous among individual genomes of a population. The evolutionary course of multiple CsRn1 copies as determined by their integration patterns was shown to be consistent with that predicted by sequence analyses (Fig. 3).
Although the distributions of CsRn1 were found to be polymorphic among individual genomes of C. sinensis (Figs. 2, 3), their effects on phenotypes were difficult to directly access because no functional gene(s) was detected in these polymorphic loci (Table 3). Homology searches for each flanking sequence revealed that the regions were largely composed of various retrotransposons. Such preference was also found in the loci showing homogeneous distributions, and no consensus bases were detected at the duplicated target site or in nearby sequences (data not shown). Since CsRn1-containing loci were selected at random from a genomic DNA library, findings on target preferences for repetitive regions are likely to be unbiased.
Like CsRn1, several retrotransposons showed preference for heterochromatic or agenic regions (Junakovic et al., 1998). There have been several interpretations of such abundances of transposable elements in these regions (Ganguly et al., 1992; Charlesworth et al., 1994). The elements in heterochromatic regions appeared to play significant roles, such as the formation of specific chromosome structures and the maintenance of genomic integrity (Biessmann et al., 1993; Steinemann and Steinemann, 1997). However, these roles have generally been proposed with fixed, stable elements residing in the heterochromatin. As mentioned above, several investigations have shown that the CsRn1 element is still active and exhibits polymorphic distributions among C. sinensis individuals. Therefore, the polymorphic distribution of CsRn1 in agenic regions is possibly related to simple tolerance against the host's defense mechanisms, because of the low density of functional genes in these regions. Alternatively, it is possible that polymorphic distribution of CsRn1 can introduce phenotypic variations in a population of C. sinensis by affecting the expression patterns of nearby heterochromatic genes. Further screening of polymorphic loci in genic or euchromatic regions might be helpful to address questions regarding the impact of polymorphic distributions.
In conclusion, CsRn1 elements were found to be comprised of several distinct subsets, which show different integration times. The multiple subsets of CsRn1 seem to evolve in the manner of a master lineage model, and among these, members of a recently expanding subset have induced considerable genomic variation among individual genomes of C. sinensis. The differential integrations of CsRn1 are likely to play significant roles in the chromosomal evolution of the trematode. Additionally, our results provide for the probable usefulness of CsRn1 as an informative molecular marker for comparative genomic studies in the populations of C. sinensis collected from various endemic areas.