Codon Usage Bias and Determining Forces in Taenia solium Genome
Article information
Abstract
The tapeworm Taenia solium is an important human zoonotic parasite that causes great economic loss and also endangers public health. At present, an effective vaccine that will prevent infection and chemotherapy without any side effect remains to be developed. In this study, codon usage patterns in the T. solium genome were examined through 8,484 protein-coding genes. Neutrality analysis showed that T. solium had a narrow GC distribution, and a significant correlation was observed between GC12 and GC3. Examination of an NC (ENC vs GC3s)-plot showed a few genes on or close to the expected curve, but the majority of points with low-ENC (the effective number of codons) values were detected below the expected curve, suggesting that mutational bias plays a major role in shaping codon usage. The Parity Rule 2 plot (PR2) analysis showed that GC and AT were not used proportionally. We also identified 26 optimal codons in the T. solium genome, all of which ended with either a G or C residue. These optimal codons in the T. solium genome are likely consistent with tRNAs that are highly expressed in the cell, suggesting that mutational and translational selection forces are probably driving factors of codon usage bias in the T. solium genome.
INTRODUCTION
It is well known that 64 different codons (61 codons encoding for amino acids plus 3 stop codons) encode 20 standard amino acids. Many amino acids are coded by more than 1 codon, and the different codons that code the same amino acid are called ‘synonymous codons’. Numerous studies have shown that the synonymous codons are used with unequal frequency, and some codons are used preferentially, a feature known as codon usage bias (CUB) [1,2]. Various hypotheses have been proposed to explain the origin of codon usage bias. Among these are the neutral theory [3] and the selection-mutation-drift balance model [4]. According to the neutral theory, mutations at degenerate coding positions should be selectively neutral, resulting in random synonymous codon choice and loss of natural selection power. In the selection-mutation-drift model, codon bias is thought to be a process mediated by a balance between mutation pressure, genetic drift, and weak selection. In other words, if a gene experiences high selective pressure, such as elevated expression, it may be inclined to result in stronger codon usage bias.
However, in recent years, with the completion of genome projects of many organisms, the 2 hypotheses are no longer sufficient to explain observed codon usage biases. Many important factors have been reported to influence this phenomenon, including gene length [5], GC-content [6], recombination rate [7], gene expression level [5], intron length [8], the hydrophobicity and the aromaticity of the encoded proteins [9], and so on.
Investigations of codon usage patterns have contributed to an understanding of the basic features of molecular organization of a genome, heterologous gene expression [10], and the prediction of gene expression levels [11], gene function [12], and gene position on chromosomes [13], and have also revealed information about the molecular evolution of individual genes. However, most of the studies on codon usage patterns focus on some model organisms and pathogenic agents, such as Caenorhabditis, Drosophila, Arabidopsis [5], yeast [14], Giardia lamblia [15], and Borrelia burgdorferi [16].
Taenia solium is one of the most important zoonotic parasites transmitted by consumption of the pork. T. solium can cause significant health problems and even death of their intermediate host (= pigs), causing considerable losses to the world economy [17]. Until now, a systematic examination of the codon usage for T. solium genome has not been performed. Here, we carried out a whole genome analysis of codon usage bias of the T. solium genome by using the multivariate analysis technique [18]. This information will contribute to a better understanding of the parasite biology and provide a new resource to help with the development of urgently needed antiparasite drugs and vaccines.
MATERIALS AND METHODS
Sequence data
The protein-coding sequences (CDS) from the T. solium genome were downloaded from http://www.genedb.org/ Homepage. To minimize sampling error, we selected sequences that were longer than 300 bp and had the initiation and termination codons annotated. After removing redundant and incomplete DNA sequences, a total of 8,484 genes were selected for analysis.
Indices of codon usage
Codon usage in the selected genes was assessed using the program CodonW (version 1.4.2, http://codonw.sourceforge.net). Relative synonymous codon usage (RSCU) is the observed frequency of a codon divided by the expected frequency if all synonyms for that amino acid are used equally. Thus, RSCU values close to 1.0 indicate lack of bias, whereas the values more than 1 indicate that the codons are used more frequently than expected; conversely when the RSCU values are less than 1, the codon is used less frequently than expected. The codon adaptation index (CAI) is a simple and effective way to measure the extent of bias toward codons that were known to be preferred in highly expressed genes. A CAI value ranges from 0 to 1.0, and a higher value means a likely stronger codon usage bias and a potential higher expression level [19]. A codon usage reference table (data not shown) was constructed with a reference set of highly expressed genes for the calculation of CAI (of the 196 genes used in the reference set, 86 encode ribosomal proteins, 6 transcription elongation factor genes, 5 pyruvate kinase genes, 1 phosphoglycerate kinase gene, 3 glyceraldehyde-3-phosphate dehydrogenase genes, 4 enolase genes, 46 actin genes, and 45 tubulin genes). GC content of the entire gene, the first, second, and third codon positions (GCall, GC1, GC2, and GC3, respectively), and effective number of codons (ENC) were calculated. GC12 values (the average of GC1 and GC2) were calculated and used for neutrality plot analyses.
Correspondence analysis
Correspondence analysis (CA) has been widely used to explore the variation in synonymous codon usage among genes [20]. CA is a sophisticated multivariate statistical technique in which codon usage data (59 codons excluding Met, Trp, and stop codons) was plotted in a multidimensional space of 59 axes. The plot was then used to identify the axes that represent the most prominent factors contributing to variation among genes.
tRNA abundance and intron number
tRNA genes in the T. solium genome were searched using the tRNAscan-SE program with the eukaryote-specific parameters [21]. tRNAscan-SE was used to predict 161 tRNA genes and 22 pseudogenes in the genome sequence (data not shown). In the present study, the pseudogenes have been removed. We used tRNA gene copy numbers as an estimate of cellular tRNA abundance. The intron/exon number of the T. solium genes was obtained from the CDS annotation (ftp://bioinformatica.biomedicas.unam.mx/TsM1_13.12.11/).
Determination of optimal codons
We selected 5% of the total genes with extremely high and low CAI values which were regarded as the high and low expression gene datasets, respectively. Codon usage was compared using chi-squared contingency test of the 2 groups, and codons whose frequency of usage were significantly higher (P <0.01) in highly expressed genes than in genes with low level of expression would be defined as the optimal codons [22].
Statistical analysis
Correlation analysis was carried out using the Spearman’s rank correlation analysis method in SPSS version 19.0.
RESULTS
Nucleotide content of T. solium genes
The nucleotide content of T. solium coding sequences (expressed as % GC) is summarized in Fig. 1. This figure shows that there is a distinctly unimodal distribution of GC content among the 8,484 T. solium genes, which is similar to T. pisiformis [23]. The GC contents of T. solium genes vary from 20.8% to 72.6% with a SD of 3.88. To understand the nucleotide distribution in 3 positions of codons, we investigated G+C content in all codons. The results showed that the G+C contents at 3 positions of codon were obviously different. GC3 was higher than the first and second positions, and GC1 was the lowest in all 3 positions of codon. The average GC content of all codons was 50.4%.
The distribution of GC contents in T. solium genes. The GC content of the 8,484 T. solium genes (shown in blue) is unimodal.
Codon usage in T. solium
The overall codon usage of 8,484 genes from T. solium was calculated, with each codon, with the exception of stop codons, represented at least 29,081 times (Table 1). The genome of T. solium had a GC content of 43.7%. Although the genome appeared to be (at least slightly) A+T-rich, overall codon usage was biased toward C- and G-ending codons. Thirty-one of the 59 codons were found to be the preferred codons, and 54.8% (17/31) of the preferred codons were either G-ending or C-ending.
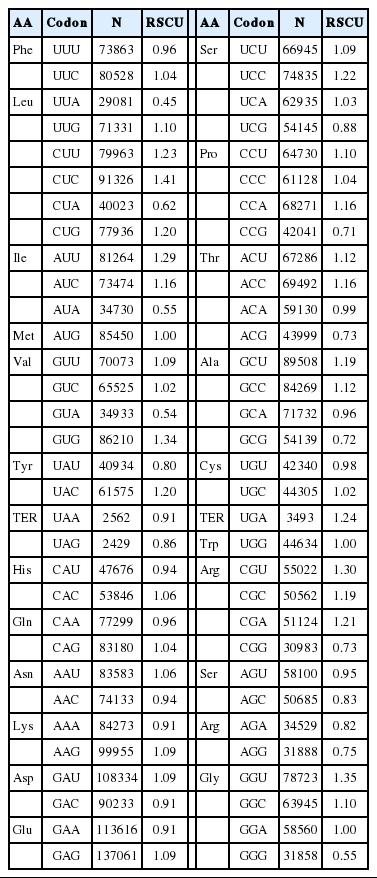
Codon usage table in T. solium
Correspondence analysis
To investigate the synonymous codon usage variation among T. solium genes, correspondence analysis was employed to explore it in RSCU. The result revealed a single major trend in codon usage, namely, that the first axis accounted for 16.7% of the total variation, while the next 3 axes accounted for 14.1%, 8.5%, and 7.2%, respectively, confirming that the primary axis is the main factor explaining codon usage in these genes. The plot of the first and second axis of each gene is shown in Fig. 2A. The distance between genes on the plot is a reflection of their diversity in RSCU, with respect to the first 2 axes. To investigate the effect of GC content of genes on codon usage bias, different GC contents of genes are color-coded. The genes, GC content of which was more than or equal to 60%, plotted in red, and less than 45% plotted in blue. Green dots indicate genes in which the GC content is between 45% and 60%. In Fig. 2A, the high and low GC content of genes separated along the primary axis is shown.
Correspondence analysis of relative synonymous codon usage (RSCU) for all 8,484 T. solium genes. (A) This panel shows the distribution of genes on the primary and secondary axes (accounting for 16.7% and 14.1% of the total variation, respectively). The 2 classes of genes (High GC and Low GC) are color coded; the high GC genes are shown in red and the low GC genes are shown in blue. (B) This panel shows the underlying distribution of codons on the same 2 axes. Codons ending with G or C are shown in red, and codons ending with A or U are shown in green.
The corresponding distribution of synonymous codons (see Fig. 2B) showed the separation of C/G-ending codons and A/U-ending codons along this same axis, indicating that the variations in synonymous codon usage among the T. solium genes were based on the nucleotide content of the genes. The separation of genes on the second axis appeared to be largely due to frequency differences in C-ending and G-ending codons among the GC rich genes (see right side of Fig. 2B).
Although the color-coding in Fig. 2A suggests a general relationship between the nucleotide content of genes and their position on the first axis of the correspondence analysis, it does not give us any statistical measure of this relationship. To do this, we calculated the correlation between the GC content of individual T. solium genes and their location on the primary axis of the Correspondence Analysis. The results were highly significant (r=0.6563, P <0.001), indicating that the variations in codon usage are strongly correlated with the nucleotide content (i.e., GC content) of the genes.
Neutrality plot and NC plot analyses
Mutation bias and translation selection are considered to be the main factors that contribute to codon usage bias in different organisms [24,25]. To identify the main factors that shape codon usage bias in T. solium, neutrality plots (GC12 vs GC3) were used to analyze the influences of mutation bias and translation selection on codon usage [26]. When the correlation between GC12 and GC3 is statistically significant and the slope of the regression line is close to 1, mutation bias is assumed to be the main force shaping codon usage. Conversely, if selection is the dominant factor, then the slope of the regression line is close to 0. The results revealed significant correlations between GC12 and GC3 (Fig. 3A). The slope of the regression line in T. solium was 0.55. This significantly positive correlation in the neutrality plots indicated that mutation pressure and selection both contribute to the codon bias in T. solium.
GC12 or ENC vs GC3s plot for 8,484 genes of T. solium. (A) GC12 vs GC3 plot (Neutrality plot analyses). The regression line is y=0.5513x+0.2196, R2=0.7309, OP=0.4894. The range of the GC3 values was 12.0%-93.4%. The cross point of the regression line and the diagonal line is defined as the optimum point (OP). (B) ENC versus GC3s plot (NC plot), the solid red line indicates the expected ENC. The ENC values of different genes ranged 21.5 to 61.0; values of GC3s ranged 10.8 to 93.3.
A plot of ENC versus GC3s (NC plot) has been used to explore the codon usage variation among genes in different organisms [27]. It is argued that if the codon choice of a gene is constrained only by a G/C mutation bias, the gene would lie either on or just below the expected curve. As shown in Fig. 3B, it is clear that although a few of the genes lie on the expected curve, the majority with a low ENC fall below the expected curve. This suggests that not only mutation but also other factors, such as translational selection, are likely to be involved in determining the variation of codon usage.
PR2-bias plot
If only mutation pressure determined codon usage bias in a gene, G and C (A and T) should be used proportionally among the 4-fold degenerate codon families. Natural selection, however, would not necessarily cause proportional use of G and C (A and T) [28]. Here, we analyzed the associations between the purine (A and G) and the pyrimidine (C and T) content in the 4-fold degenerate codon families using the type 2 parity rule (PR2) bias plot (Fig. 4). Our results showed that C and T are used more frequently than G and A in these degenerate codons, suggesting that together with mutation pressure, other factors (such as selection) may influence the codon usage bias.
Parity rule (PR2)-bias plot. The red open circle indicates the average position x=0.4340±0.0887 and y=0.4458±0.0927.
Relationship between CUB and the gene expression level
To explore the correlation between CUB and expression levels, we calculated the correlation coefficient between ENC and CAI to measure of the expression level of selected genes. The results show CUB is weakly and negatively correlated with the gene expression levels (r=-0.1804, P <0.001), suggesting that the genes with higher expression levels tend to have a higher codon usage bias (such as those encoding actin genes and ribosomal proteins tend to have lower ENC values) (Fig. 5).
Plot of ENC versus hydropathicity index and aromaticity score for T. solium genes.
Relationship between codon bias and hydropathicity index and aromaticity score
Numerous studies have shown that the hydropathicity and aromaticity of encoded protein play important roles in shaping codon usage of some species [29]. In order to investigate if the same thing happens to T. solium, we conducted a correlation analysis between codon usage bias and hydropathicity index (Gravy) and aromaticity score (Aromo) values. The correlation coefficients for the Gravy and Aromo scores (r=-0.0468, P <0.001; r=0.055, P <0.001, respectively) indicated that the hydropathicity and aromaticity of the encoded proteins were associated with the codon usage bias.
Relationship between CUB and protein length
In general, codon usage bias might be affected by the gene length. Here, we conducted a correlation analysis between codon bias and protein length. Our data demonstrated that ENC values are significantly and positively correlated with protein length, as expected (r=0.1138, P <0.001) (Fig. 6). The results indicated that protein length shaped codon usage in T. solium and the longer genes had a lower degree of codon bias.
Plot of ENC versus protein length for T. solium.
Relationship between CUB and intron number
Evidence has been assembled to suggest that CUB has a close relationship with intron number [8,30]. However, the relationship between CUB and intron number is at present unclear. Here, we performed a correlation analysis to evaluate whether ENC values were related to intron number. From this analysis, results showed that ENC values are significantly and positively correlated with the intron number (r=0.1324, P <0.001) in T. solium (Fig. 7). The analysis results suggested that the intron number was associated with codon usage variation.
Plot of ENC versus intron number for T. solium.
Optimal codons and tRNA abundance in T. solium
The average RSCU values of high/low expressed gene sample group are listed in Table 2. Twenty-six codons were determined to be the optimal codons, which were significantly more frequent among the highly expressed genes (P <0.01) according to the chi-square test. Almost all of optimal codons (except GGU and CGU) ended with G or C.

Optimal codons and tRNA abundance in T. solium
Previous studies suggested that the optimal codons tend to correspond to highly expressed tRNAs and tRNA gene copy numbers [31,32]. Here, we conducted an analysis to test whether this trend also existed in T. solium genome. We used tRNA gene copy numbers as a substitute for tRNA abundance in the cell. We found that there is good correspondence between tRNA abundance and optimal codons, 13 of the 26 optimal codons corresponded to the most abundant tRNAs (Table 2).
DISCUSSION
Base composition is an important feature of a genome and is the main force that affects codon usage. GC-rich organisms, such as bacteria, archea, fungi, Triticum aestivum, Hordium vulgare, and Oryza sativa [33,34], tend to use G or C at the third position. However, AT-rich organisms show a preference for A or T at third position, such as Onchocerca volvulus, Mycoplasma capricolum, and Plasmodium falciparum [35]. The genome of T. solium has a G+C content of 43.7%. Although the genome would thus appear to be slightly A+T rich, overall codon usage was biased toward C- and G-ending codons (Table 2), this phenomenon is also found in G. lamblia [17].
Neutrality analysis found that there was a significant correlation between GC12 and GC3, which suggests that mutations may play a more important role in codon usage bias in T. solium. Meanwhile, ENC-plot analysis revealed that a majority of the points with low-ENC values lay below the expected curve, with only a few genes observed to lie on the expected curve, an indication that besides mutation bias, selection was also involved in determining the codon bias of some genes. However, because NC plot analysis cannot distinguish between mutation bias and selection within a species, Wright [27] suggested 2 ways to distinguish between selection and mutation bias. If mutation bias is the cause of codon bias, GC or AT should be used proportionally among the degenerate codon groups in a gene. In contrast, natural selection for codon choice would not necessarily cause proportional use of G and C (A and T). However, the PR2 plot showed that the CDS in the T. solium genome did not use GC and AT equally. The unequally used GC and AT in the degenerate codon positions in our current analysis further reflects the fact that selection pressure has played an important role in driving CUB of T. solium. From these findings, we can conclude that both mutation bias and selection have contributed to the codon bias in the T. solium genome.
Generally, it was thought that codon usage bias was affected by gene length. In this paper, protein length appeared to play a significant role in shaping codon bias in T. solium. Thus, we found that codon bias was negatively correlated with protein length. Similar results have been found in many organisms, such as yeast [36], Caenorhabditis elegans [37], Drosophila melanogaster [6], and Arabidopsis thaliana [5]. An explanation as been proposed by Moriyama and Powell [38] for this phenomenon; namely, if shorter proteins could perform similar functions to those of longer ones, longer proteins become energy-expensive and disadvantageous, thus the selection constraint acts to reduce the size of highly expressed genes, dominantly determines the relationship between codon bias and gene length.
Until now, the role of introns in the codon bias usage of eukaryotic genes remains enigmatic. As mentioned above, recent studies have shown that intron length is closely related to codon usage, suggesting that introns may play a role in gene regulation [30]. However, the relationship between codon bias and intron number is at present unclear. To explore this relationship, the sequences of a set of genes containing between 0 and 77 introns was extracted from the published genome sequences of T. solium. Our results suggested that CUB was negatively related to intron number; in other words, genes with the higher codon bias were found to have fewer introns. The loss of intron is a major feature of eukaryotic evolution [39]. It has been shown that introns in highly expressed genes are substantially shorter than those in genes that are expressed at low levels [40], and that rapidly regulated genes are intron poor [41]. These reports suggested that introns might play a role in the negative regulation and expression of these genes. On the other hand, numerous studies have shown that codon bias is generally positively correlated with gene expression level whereas highly expressed genes (such as ribosomal proteins) usually exhibit higher levels of codon bias [42]. Based on these studies, we conclude that the negative relationship between codon bias and intron number may have a role in gene expression in T. solium.
In this study, we identified 26 codons as the optimal codons in the T. solium genome. Most importantly, optimal codons in the T. solium genome were found to end either with G or C. This is very similar to the pattern observed in other eukaryotic genomes, such as D. melanogaster [43], C. elegans [44], G. lamblia [17], and Schizosaccharomyces pombe [45]. The identification of optimal codons in this parasite will impact the design of degenerate primers, introduction of point mutations, and investigation of mechanism(s) of evolution of the species at the molecular level.
Acknowledgements
This work was supported by the 863 program (no. 2006AA 10A207), the Gansu Natural Science Foundation (no. 1010RJZ A002), and the National Key Project of Scientific and Technical Supporting program (no. 2007BAD40B03), China.
Notes
We have no conflict of interest related to this work.