Isoenzyme patterns and phylogenetic relationships in Acanthamoeba spp. isolated from contact lens containers in Korea
Article information
Abstract
In order to refer to the basic information regarding the identification of isolates obtained from a contact lens container in Korea, the isoelectric focusing gel electrophoresis was employed to compare the isoenzyme band patterns among Acanthamoeba spp. including eight isolates and the simple pairwise dissimilarity analysis was carried out. For an alkaline phosphate development, isolate 7 and Acanthamoeba polyphaga showed homologous band patterns, and isolates 1, 2, and 3 showed the same patterns. For lactate dehydrogenase, similar patterns were observed in isolates 2 and 3. Isolates 3 and 5 showed homologous band patterns for malate dehydrogenase and glucose phosphate isomerase. For hexokinase, isolates 4, 7, and A. hatchetti showed the same band patterns. In others, a considerable number of interstrain polymorphisms was observed in nine isoenzyme band patterns. In Acanthamoeba group II, genetic distances among isolates 1, 2, 3, 4, and 5 ranged from 0.104 to 0.200. In comparison to A. castellanii, A. hatchetti, and A. polyphaga, genetic distances of isolates 7 and 8 were 0.254 and 0.219, respectively. In Acanthamoeba group III, including A. culbertsoni, A. healyi, and A. royreba, isolate 6 had genetic distances which ranged from 0.314 to 0.336. Finally, when comparing to the six reference Acanthamoeba, it was possible to classify isolates 1, 2, 3, 4, and 5, as genetically close-related species and as independent species group. Furthermore, isolates 6, 7 and 8 were identified as independent species as well.
INTRODUCTION
Acanthamoeba spp. inhabit in soil, pond, sewage, and in the atmosphere. Acanthameoba culbertsoni and A. healyi cause chronic glanulomatous amoebic encephalitis (GAE), and A. polyphaga and A. castellanii are a causative agent of the acanthamoebic keratitis (Stehr-Green et al., 1989; Visvesvara and Stehr-Green, 1990; Moura et al., 1992; van Klink et al., 1992). In Korea, two probable GAE cases and one acanthamoebic pneumonia case, and several acanthamoebic keratitis cases have been reported (Ringsted et al., 1976; Kim et al., 1995; Im and Kim, 1998).
The basic classification of Acanthamoeba spp. has depended upon the morphological characteristics of trophozoites and cysts (Page, 1976; Pussard and Ponds, 1977). In addition, the comparison of isoenzyme patterns was a useful tool (De Jonckheere, 1983; Costas and Griffiths, 1985) and molecular techniques were applied for the classification of Acanthameoba spp. which include the restriction fragment length polymorphism (RFLP) analysis of mitochondrial DNA and 18S SSU RNA (small subunit ribosomal RNA) using the polymerase chain reaction (PCR) technique (McLaughlin et al., 1988; Kilvington et al., 1991; Hinkle and Sogin, 1993; Chung et al., 1998).
For the past two decades, biological characterization of amoebae has been focused on isoenzymes. On the basis of starch gel electrophoresis of isoenzymes, pathogenic and nonpathogenic strains of Entamoeba and Naegleria could be separated (Nerad and Daggett, 1979; Sargeaunt and Williams, 1979; De Jonckheere, 1983). Although N. fowleri could be distinguished from other species of the same genus, it was not clear whether such distinction could be made for other members of the family or not (Daggett and Nerad, 1983). Nevertheless, Costas and Griffiths (1985) reported the taxonomy of 32 strains of Acanthameoba using starch gel electrophoresis.
In this study, in order to refer to some basic information on the identification of Acanthamoeba spp. isolated from contact lens containers in Korea, isoelectric focusing gel electrophoresis was attempted to compare band patterns of nine isoenzymes, and the simple pairwise dissimilarity analysis was carried out.
MATERIALS AND METHODS
Acanthamoeba
Eight Acanthamoeba were isolated from contact lens containers in Korea (in 1997, by Prof. Dong-Il Chung and their collaborators), and reference amoebae such as A. culbertsoni, A. healyi, A. royreba, A. castellanii, A. polyphaga, and A. hatchetti (Table 1) were cultured in Proteose Peptone-Yeast extract-Glucose (PYG) medium (Visvesvara and Balamuth, 1975) at 25℃ and 37℃.

Eight isolates and six reference Acanthamoeba spp.
Lysate preparation of Acanthamoeba
Cultured trophozoites (1×10⁸) of each amoebae were harvested and washed with phosphate buffered saline (PBS, pH 7.4). Each suspension of trophozoites was in 1 ml of PBS and was frozen (-70℃) and thawed (37℃) three times, and centrifuged at 10,000 g for 2 hr. After the supernatants were filtered with 0.25 µm disk filter, the protein concentration (adjusted to 10 mg/ml) was determined. Samples were stored at -70℃ until usd.
Isoelectric focusing
For isoenzyme developments, the isoelectric focusing was done by using Novex Pre-cast vertical IEF gel, pH 3-10 and 1 mm thick, with the Vertical Electrophoresis Kits (Novex, San Diego, USA). The amoeba lysates were prepared by adding one part sample to one part sample buffer (10× cathode buffer 2.0 ml, glycerol 3.0 ml and D.W. to 10.0 ml), and added to each well. Then, both cathode buffer (arginine 3.5 g, lysine 2.9 g and D.W. to 1,000 ml) and anode buffer (8.5% phosphoric acid 4.7 g and D.W. to 5,000 ml) were added to each corresponding chamber. Isoelectric focusing was performed at 100 V (volt) for 1 hr, 200 V for 1 hr and 500 V for 30 min.
Isoenzyme developments
After isoelectric focusing, gels were put into each chamber containing several kinds of substrate solutions for the isoenzyme development. Nine kinds of isoenzymes, acid phosphatase (AcP), glucose phosphate isomerase (GPI), glucose-6-phosphate dehydrogenase (G-6-PD), Hexokinase (HK), malate dehydrogenase (MDH), malic enzyme (ME), leucine aminopeptidase (LAP), lactate dehydrogenase (LDH) and propionyl esterase (PE) were developed. Each substrate with appropriate experimental condition was prepared according to the previous papers (Costas and Griffiths, 1985; Shin et al. 1993). After each development of isoenzymes, gels were pretreated with 7.5% acetic acid solution, and differentiated in 10% acetic acid and 25% ethanol until the background was clear.
Phylogenetic relationships among Acanthamoeba
The developed isoenzyme band patterns of Acanthamoeba spp. were compared to the pairwise dissimilarity value (Nei and Li, 1979), and dendrograms of genetic relationships among Acanthamoeba spp. were produced with the unweighted pair-group method with the arithmetic mean analysis (UPGMA) using PHYLIP program (Felsenstein, 1993).
RESULTS
Isoenzyme patterns of Acanthameoba
Various band patterns of nine isoenzymes for fourteen strains of Acanthamoeba were observed (Figs. 1, 2). A considerable amount of interstrain polymorphms of zymograms was observed for nine isoenzymes, except for the isolates described below. Being assigned to Acanthamoeba group II, isolates 1, 2, and 3 showed the same patterns for GPI, MDH, and LAP developments. For an LDH development, similar patterns were shown for isolates 2 and 3. Isolates 3 and 5 showed homologous band patterns for MDH and GPI developments. Isolate 7 and A. polyphaga showed some homologous band patterns for AcP development. For a hexokinase development, isolates 4, 7, and A. hatchetti showed the same homologous band patterns. Being assigned to Acanthamoeba group III, the isolate 6 showed interspecies polymorphisms in nine isoenzymes developments, although A. healyi and A. royreba showed somewhat homologous band patterns for AcP development.
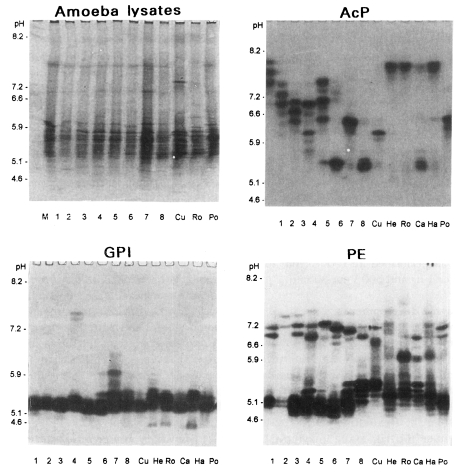
Photographic findings of three isoenzyme band patterns of eight isolates (1-8), A. culbertsoni of Acanthamoeba spp. (Cu), A. healyi (He), A. royreba (Ro), A. castellanii (Ca), A. hatchetti (Ha) and A. polyphaga (Po). AcP, acid phosphatase; GPI, glucose phosphate isomerase; PE, propionyl esterase. Left-upper figure shows protein profiles of amoeba lysate stained by Coomassie Brilliant Blue R.
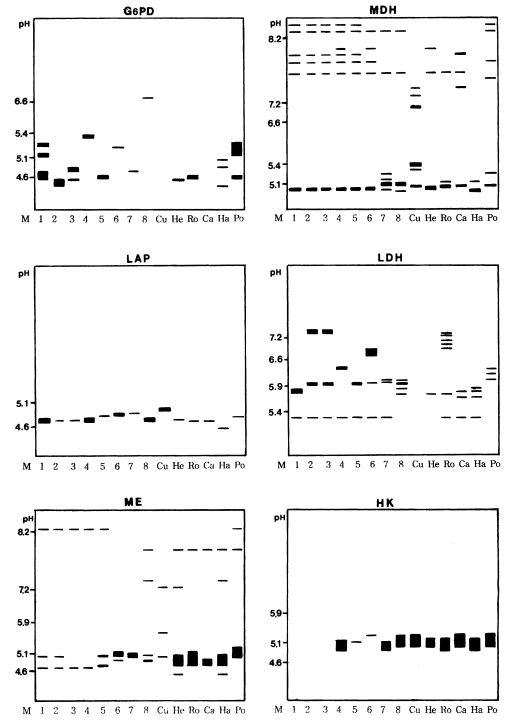
Diagrammatic representations of six isoenzyme band patterns of eight isolates of Acanthamoeba spp. (1-8), A. culbertsoni (Cu), A. healyi (He), A. royreba (Ro), A. castellanii (Ca), A. hatchetti (Ha) and A. polyphaga (Po). G-6-PD, glucose-6-phosphate dehydrogenase; MDH, malate dehydrogenase; LAP, leucine aminopeptidase; LDH, lactate dehydrogenase; ME, malic enzyme; HK, hexokinase.
Similarity and genetic relationships
As a result of the summation of nine isoenzyme band patterns, the values of the pairwise dissimilarity were calculated among Acanthamoeba group II including seven isolates and isolate 6 of Acanthamoeba group III (Table 2, 3). In Acanthamoeba group II, the dissimilarity values varied from 0.207 to 0.806 with genetic distances ranging from 0.14 to 0.323. In isolates 1, 2, 3, 4, and 5, the dissimilarity values ranged mostly from 0.207 to 0.458, which the genetic distances were from 0.104 to 0.200. In other Acanthamoeba spp. including isolates 7 and 8, the dissimilarity values ranged from 0.397 to 0.806, which the genetic distances ranged from 0.199 to 0.336. Between isolates 7 and 8, the genetic distance was 0.254 (Fig. 3). In Acanthamoeba group III including isolate 6, the dissimilarity values varied from 0.400 to 0.695 with genetic distances ranging from 0.200 to 0.336 (Fig. 4).
Proportions of homologous fragments and pairwise dissimilarity calculated by summation of nine isoenzyme patterns in Acanthameoba group II

Proportions of homologous fragments and pairwise dissimilarity calculated by summation of nine isoenzyme patterns in Acanthameoba group III
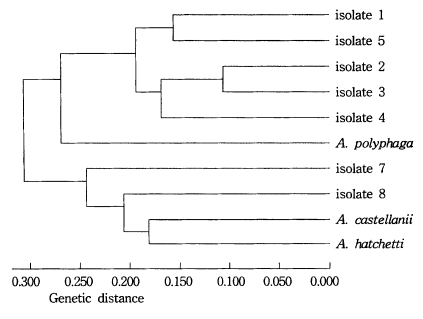
Dendrogram of seven isolates and Acanthamoeba group II based on the dissimilarity estimates by UPGMA methods.
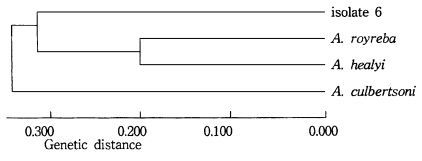
Dendrogram of isolate 6 and Acanthamoeba group III based on the dissimilarity estimates by UPGMA methods.
DISCUSSION
In the taxonomy of 32 strains of Acanthameoba, Costas and Griffiths (1985) reported on the application of starch gel electrophoresis. Strains that had originated from the same isolate had similar zymograms. Strains that had been assigned to the same species-especially A. castellanii and A. polyphaga-did not always have similar enzyme patterns. De Jonckheere (1983) reported the isoenzyme analysis by agarose isoelectric focusing for the taxonomy of the genus Acanthamoeba. Especially, strains of A. castellanii, two strains, 76-2252 and A-1, showed different zymograms from Neff strain. Although it appears to be possible to distinguish different isoenzymes, Ma et al. (1990) reviewed that the application of the techniques to other amoebae does not yield clear-cut results.
Most previous studies were performed by starch gel electrophoresis which only revealed 2 to 5 band patterns. Pernin et al. (1985) reported the phylogenetic relationships in the genus Naegleria, with sixteen isoenzymes analysis using the calculation of genetic distances based upon Nei's standard index, which could be applied to both diploid and haploid organisms whether they reproduce sexually or not. In their studies, there were some problems regarding the presence of allozymes as well as the existence of considerable number of parameters involving isozymes.
In this paper, we employed isoelectric focusing gel electrophoresis and the simple pairwise dissimilarity analysis of isoenzyme band patterns which could be detected in a few isoenzyme developments. Mostly, a considerable amount interstrain and interspecies polymorphism of zymograms were observed for nine isoenzymes in this study. Being assigned to Acanthamoeba group II, nevertheless, isolates 1, 2, and 3 showed the same patterns for GPI, MDH and LAP developments. For an LDH development, similar patterns were shown for isolates 2 and 3. And isolates 3 and 5 showed homologous band patterns for MDH and GPI. In comparison to the other reference amoebae which showed considerable interspecies polymorphisms, isolates 1 to 5, at least, could be classified as closely-related strains; thus, being assigned to a new species with genetic distances ranging from 0.104 to 1.200. Also, isolates 7 and 8 could be assigned to an independent species, as shown in the dendrogram based upon the pairwise dissimilarity analysis, which the genetic distances ranged from 0.219 to 0.254. In previous study by Kong et al. (1995), the interstrain polymorphism of isoenzyme profiles by isoelectric focusing among seven strains assigned to A. polyphaga was observed: A. polyphaga Ap strain was similar to Jones strain, but other strains including the Korean isolates (KA/S3, KA/S6 and KA/S7) did not show similar band patterns, especially for AcP, LDH, and G-6-PD developments. In this paper, the interspecies polymorphism was not observed among reference amoebae. Being assigned to Acanthamoeba group III including A. culbertsoni, A. healyi and A. royreba, the isolate 6 should be classified as a new species, since its genetic distance ranged from 0.314 to 0.336.
Ultimately, in many previous studies as well as the present study, it was emphasized that the isoenzyme analysis may be a strong tool in assigning Acanthamoeba strains to species, but different band patterns may be detected within a species. Thus, first of all, a type of strains and/or a type species should be established. Therefore, the isoenzyme band patterns analysis must not be used as the sole criterion to assign new species. Also, a variety of different criteria should be considered in describing new species.
ACKNOWLEDGEMENT
We thank Professor Dong-Il Chung, Department of Parasitology, College of Medicine, Kyungpook National University, for donating reference amoebae including the Korean isolates. We would also like to thank Dr. Ui-Wook Hwang, Department of Parasitology, College of Medicine, Yonsei University, for assisting the statistical analysis. We also thank Professor Hyung-Il Kim, Millina Lee and Sun Park, Department of Microbiology, Ajou University School of Medicine, for commenting on this study.
Notes
This study was supported by the grant from Ministry of Education for Basic Medical Science, 1997 (#97-L4).